If you follow crypto, you already know the problem: the numbers you need are spread across many different websites. One site shows prices, another shows DeFi data, and a third shows derivatives. CoinDuck tries to fix this by putting the key numbers on one platform. In this guide, we will walk through the whole website, one page at a time, and show you how you can use each page for your own research.
What Is CoinDuck?
CoinDuck is a free crypto analytics platform. It shows live data from crypto exchanges, decentralized exchanges (DEXs), derivatives markets and DeFi protocols. Instead of opening many tabs, you can compare prices, trading volume, open interest, funding rates, total value locked (TVL), fees and revenue from a single website.
What Data Can You Track on CoinDuck?
- Price and 24h change: how much a coin has moved in the last day
- Trading volume: how much trading is happening
- Open interest: the total value of open derivatives positions
- Funding rates: the cost of holding long or short positions in perpetual futures
- Total Value Locked (TVL): how much money is deposited in DeFi protocols
- Fees and revenue: how much money protocols earn from their users
Which Crypto Ecosystems Does CoinDuck Cover?
CoinDuck has dedicated dashboards for decentralized perpetual exchanges such as Hyperliquid dashboard, Aster dashboard, Variational Omni dashboard, Lighter dashboard, or EdgeX dashboard. It also covers DeFi and DEX projects such as Uniswap, Aave, Morpho and Jupiter. The TVL, DEX Volume and Fees pages go further and include hundreds of other protocols across many blockchains.
Now that you know what the platform offers, let us start where every visitor starts: the home page.
How to Read the CoinDuck Home Dashboard
The home page works like a control room for the whole website. It gives you a quick market snapshot and then points you to the deeper pages. Here is what you will find on it, from top to bottom.
Exchange Cards at the Top
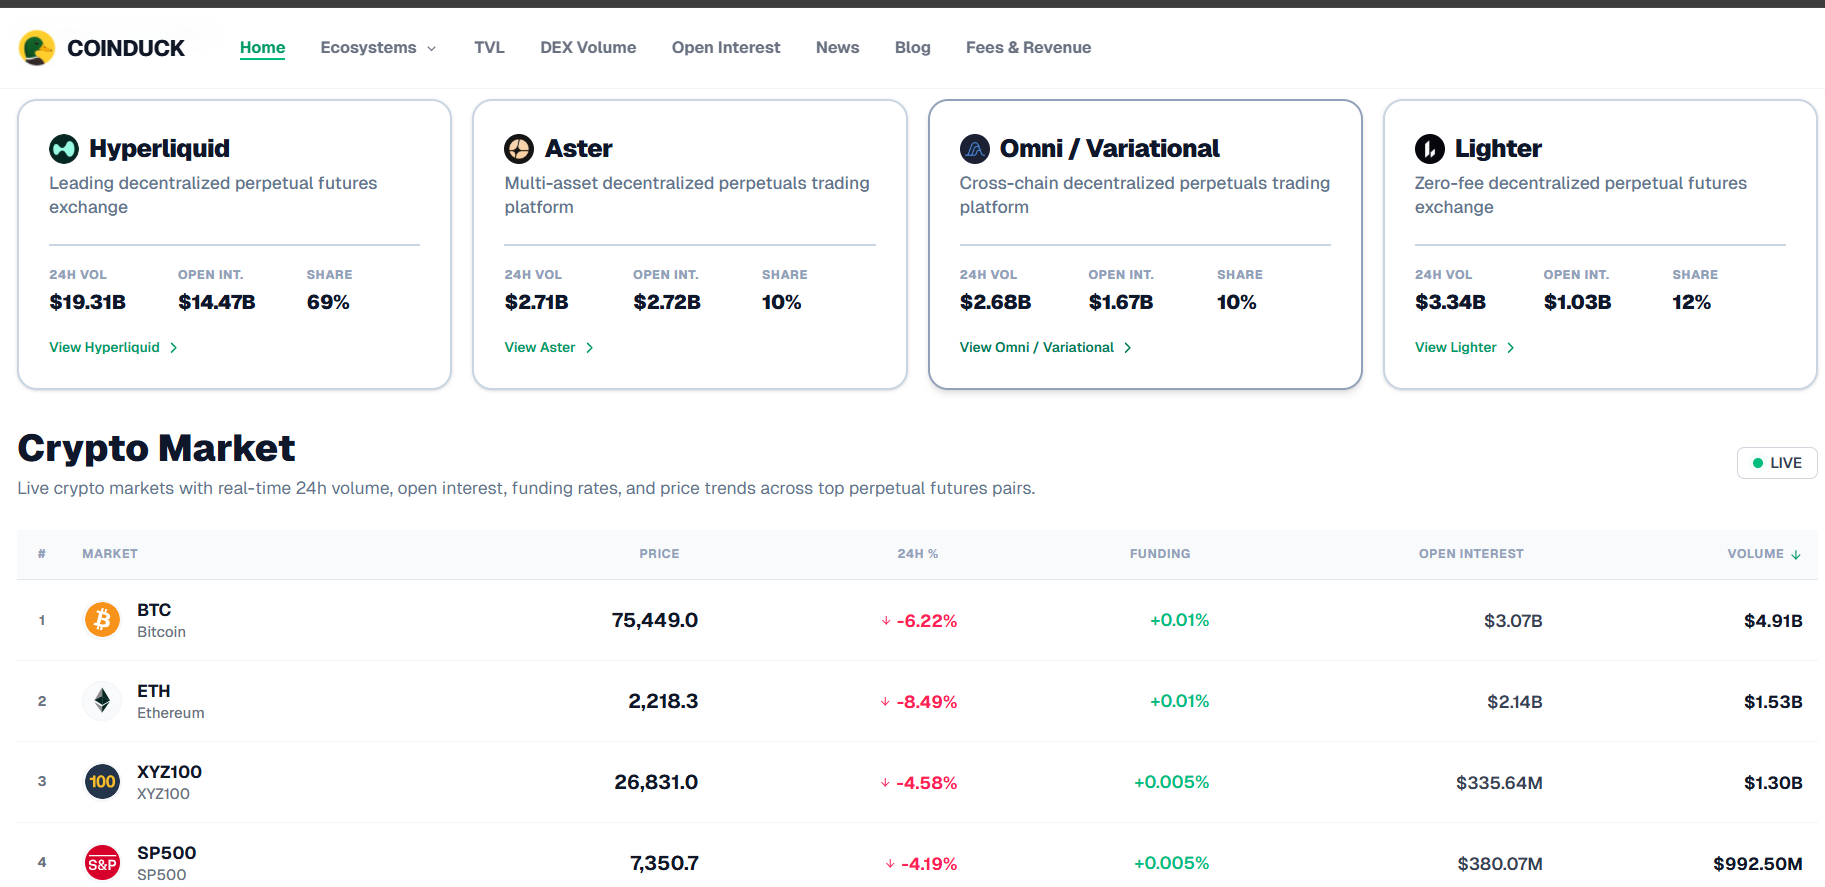
At the top, you will see cards for the main perpetual exchanges, such as Hyperliquid, Aster, Lighter and Omni/Variational. Each card is designed to show the exchange's 24-hour volume, its open interest and its market share, with a button to open that exchange's full dashboard. Some values may show a dash when data is not available for that exchange.
The Live Crypto Market Table
Below the cards is the live market table. Every row is a trading market, and the columns show the price, the 24-hour price change, the funding rate, the open interest and the 24-hour volume. You will see big names like Bitcoin (BTC), Ethereum (ETH), Solana (SOL) and Hyperliquid's HYPE token. You will also see other markets listed on Hyperliquid, so the table is not limited to coins.
Tip: you can sort the table by any column. Sort by volume to see where trading is heaviest, or by 24-hour change to spot the biggest movers.
Chain Distribution and Analytics Shortcuts
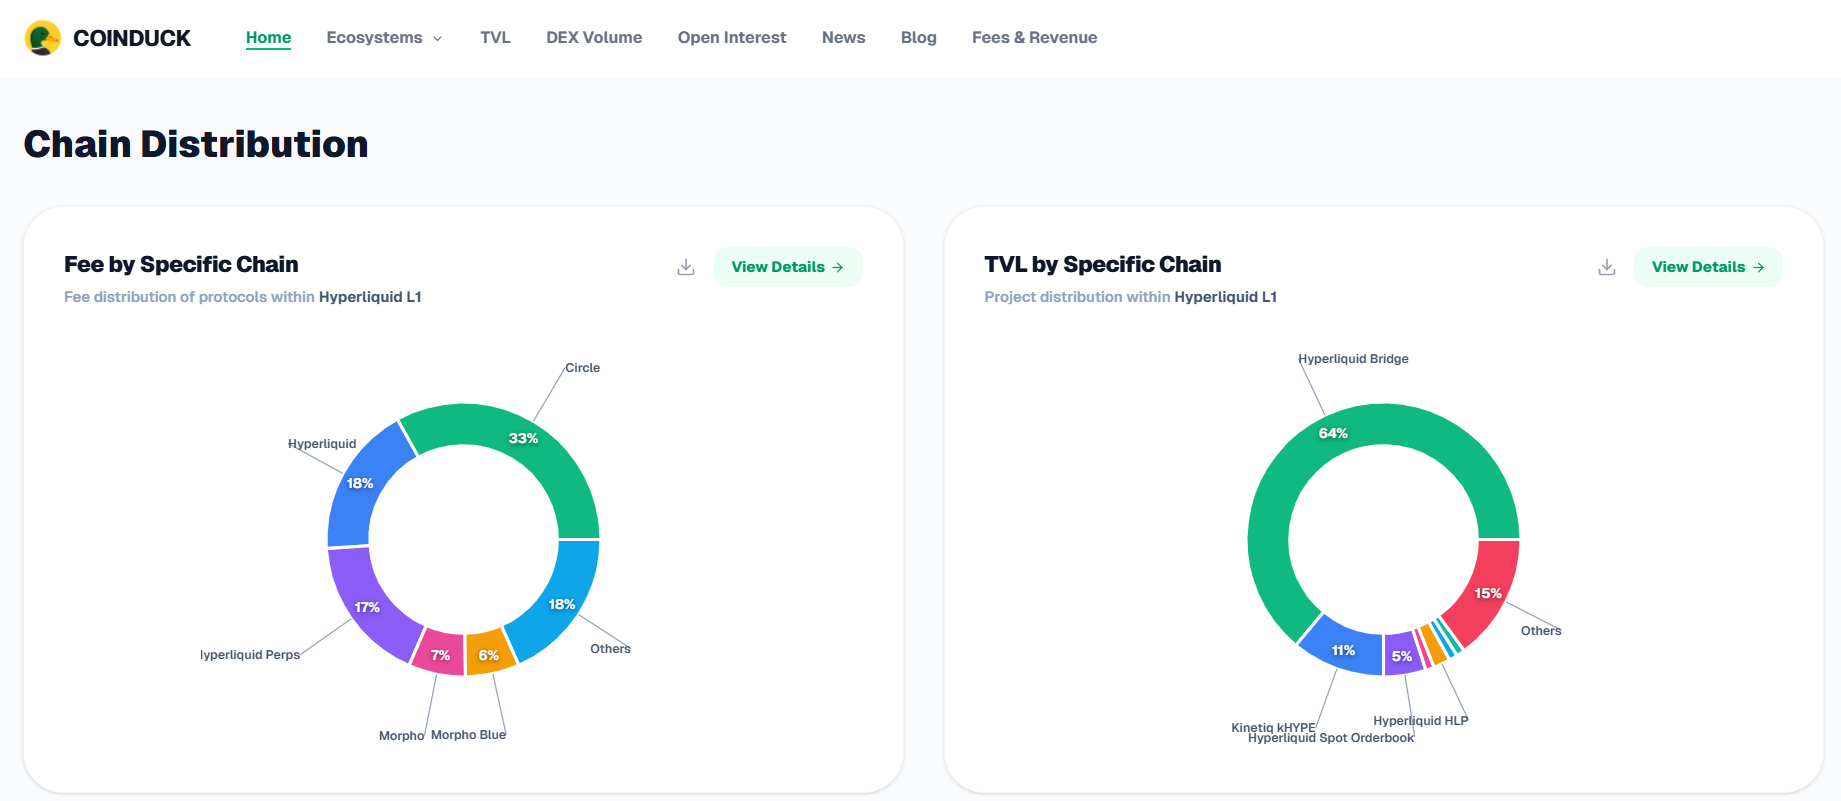
Further down, the home page shows charts that break fees and TVL down by blockchain. After that, four cards link to the main analytics pages: DEX Volume, Open Interest, TVL, and Fees & Revenue. The last block shows the latest crypto news.
Those four analytics pages are the heart of CoinDuck, so let us open them one by one. We will start with TVL, because it is the easiest way to see where money is sitting in DeFi.
Total Value Locked (TVL) Page: See Where DeFi Money Is Stored
Total Value Locked, or TVL, is the total value of assets that users have deposited into a protocol's smart contracts, shown in US dollars. It is one of the most watched numbers in DeFi because it shows how much capital people trust a protocol with.
What You Will See on the TVL Page
- Summary boxes showing the number of protocols, categories and chains being tracked
- Protocol Explorer: a table that ranks protocols by TVL and shows each protocol's category
- Chain Distribution: a chart showing which blockchains hold the most value
- Top Protocols: a quick list of the top 10 by TVL
How to Use the TVL Page
- Open the TVL page.
- Use the category filter to focus on one area, such as lending, liquid staking, bridges or restaking.
- Use the chain filter to see protocols on one blockchain.
- Switch the sorting between high-to-low and low-to-high to find the biggest or the smallest protocols.
For example, if you want to compare lending platforms, filter the category to "Lending" and see how protocols like Aave and Morpho stack up against each other.
What TVL Does Not Tell You
TVL does not measure trading activity or profit. A protocol can hold a lot of money but have few users trading, or it can hold less money and still earn a lot in fees. That is why it is smart to check TVL together with volume and fees, which we cover next.
TVL tells you how much money is parked in DeFi. To see how much of it is actually being traded, we move on to the DEX Volume page.
DEX Volume Page: Track Decentralized Exchange Trading Activity
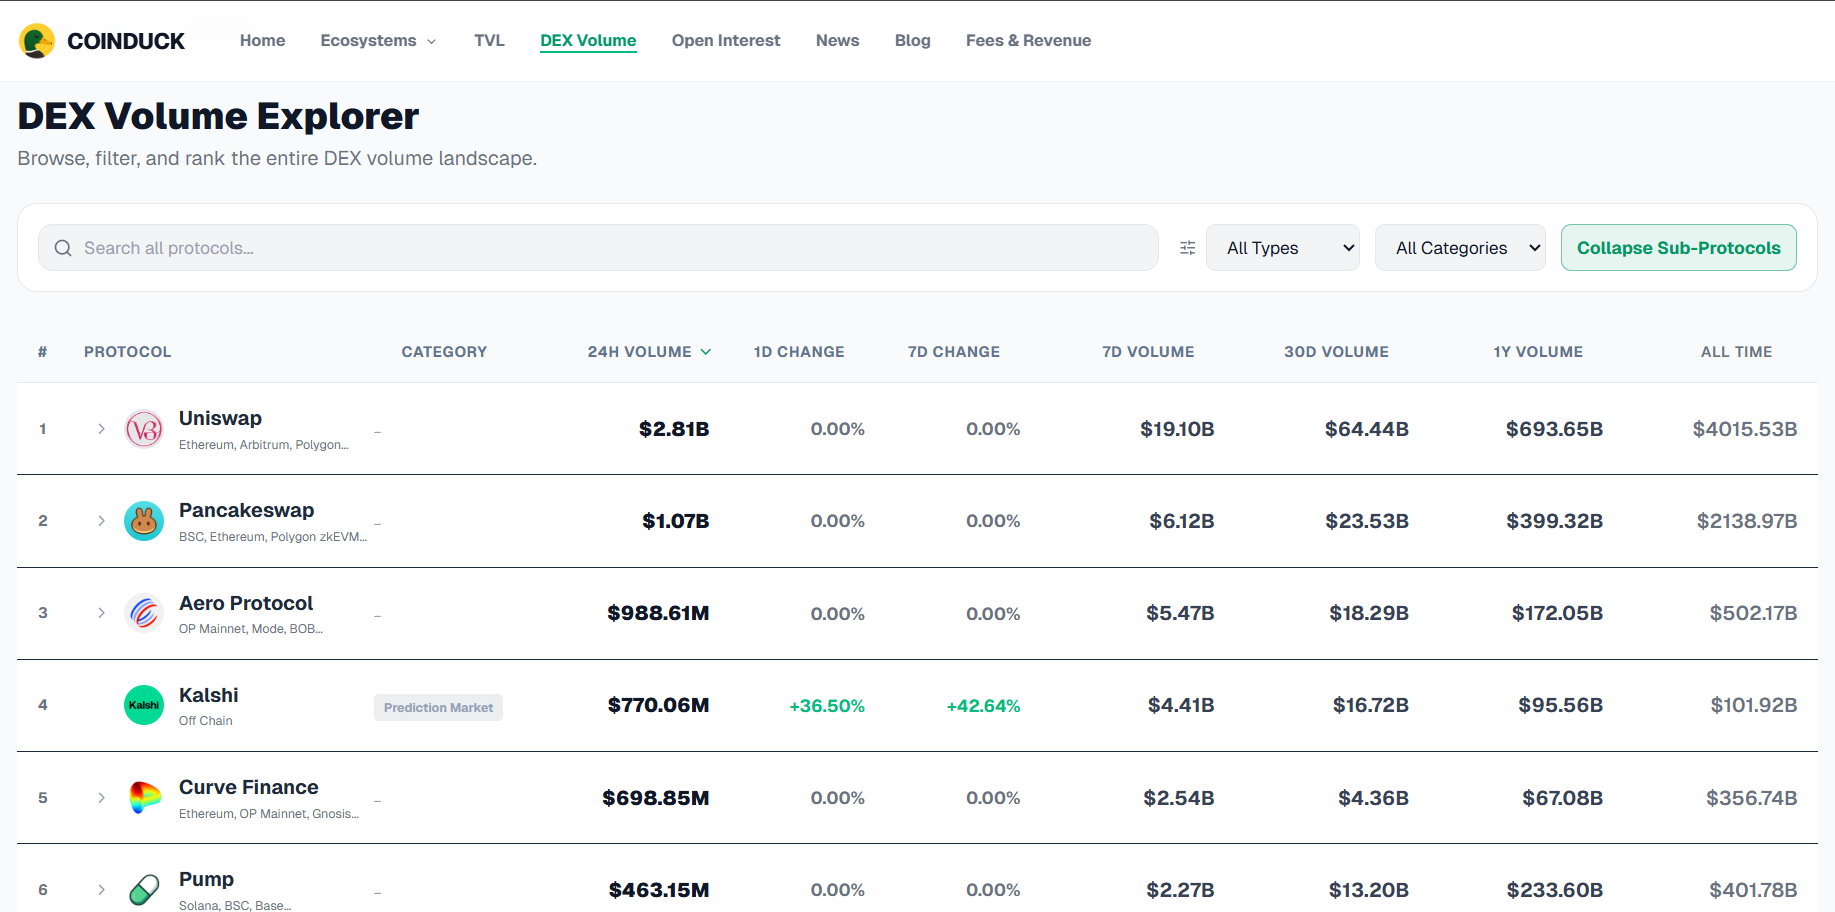
Trading volume is the total value of trades executed in a period of time. On the DEX Volume page, CoinDuck shows this number for decentralized exchanges, so you can see where trading activity is concentrated.
Total Volume Summary Cards
At the top of the page, four cards give you a quick snapshot of the whole DEX market:
- Total Volume (24h): the value of all DEX trades in the last 24 hours. A small percentage next to it compares today with yesterday.
- Total Volume (7d): the total trading volume over the last 7 days, which gives you a bigger picture than one day.
- Active Protocols: how many DEX protocols had trading activity.
- Active Chains: how many blockchains had trading activity.
If the percentage is green and positive, trading is higher than yesterday. If it is negative, trading has slowed down.
Global Volume Trend Chart
The chart shows the total daily volume of all DEX protocols together, so you can see how trading activity has moved over time.
You can change the chart in three ways:
- Time range: choose 7D, 30D, 90D, 1Y or All.
- Chart style: switch between Area and Bar. Area shows the overall shape of the trend, and Bar makes it easier to compare single days.
- Breakdown: split the total into smaller parts to see what it is made of.
How to read it: if the chart has been climbing for weeks, more people are trading. If it keeps falling, interest is cooling down. Sudden spikes usually come from big market moves or news.
Volume by Category
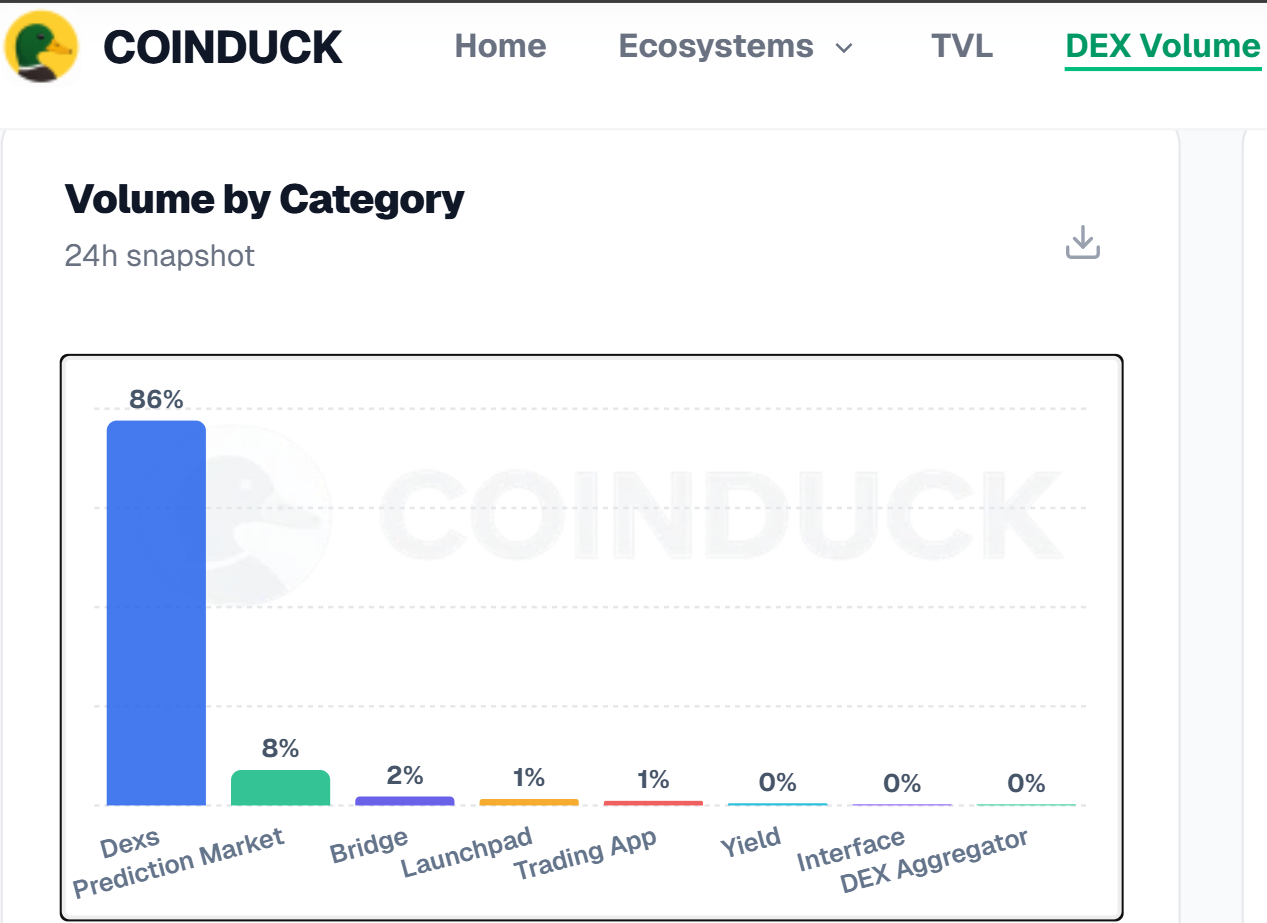
This card is a bar chart with the label "24h snapshot". It shows how the last 24 hours of trading volume is split between different types of platforms. Each bar has a percentage on top, which is that category's share of the total.
The categories in the chart include:
- Dexs: classic decentralized exchanges. In the screenshot, this is by far the biggest bar at about 86%.
- Prediction Market: platforms where people trade on the outcome of events, at about 8%.
- Bridge: tools that move crypto between blockchains, at about 2%.
- Launchpad and Trading App: smaller categories, around 1% each.
- Yield, Interface and DEX Aggregator: very small shares, close to 0%.
When you move your mouse over a bar, a small box appears with the category name, its volume in dollars and its share. For example, in the screenshot, Yield shows about $55.45M, which is a 0.5% share. There is also a download icon in the top-right corner of the card, which is normally used to save the chart.
Why it matters: this chart shows which kind of trading is leading, not just which single app is big. It also reminds you that the volume number on this page is not made only of classic DEXs.
Top Volume Movers (24H)
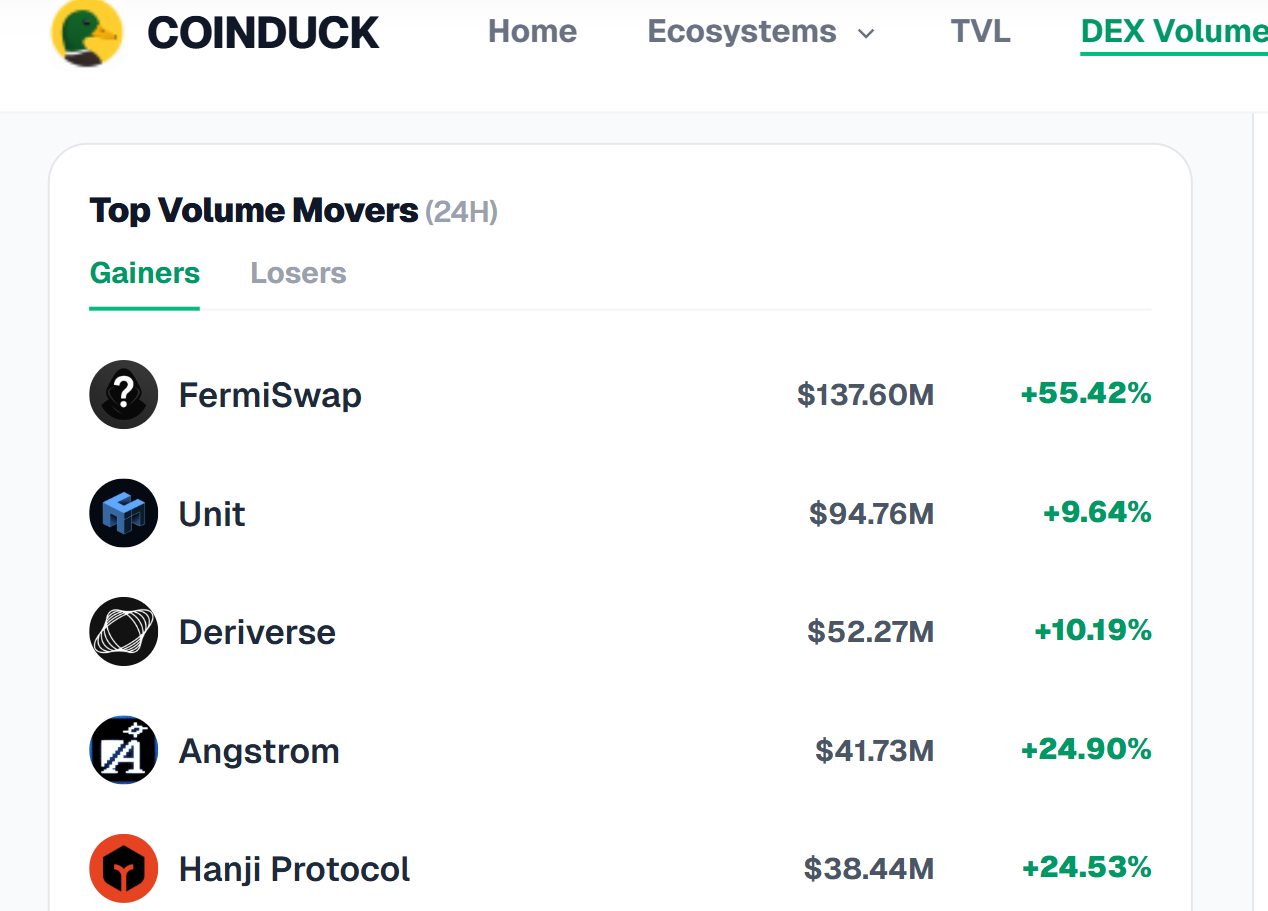
This card has two tabs: Gainers and Losers. Each row shows a protocol name, its 24-hour volume, and how much that volume changed compared with before.
- Gainers are protocols whose volume grew the most. In the screenshot, FermiSwap is at the top with about $137.60M and a +55.42% change, followed by Unit, Deriverse and Angstrom.
- Losers are protocols whose volume dropped the most. Click the Losers tab to see them.
How to use it: gainers can help you notice a protocol that is suddenly getting attention. Losers can show where activity is fading. A big percentage jump does not always mean a protocol is better, especially when the starting volume was small, so check the dollar amount as well.
Leaderboard: Top 15 by 24h Volume
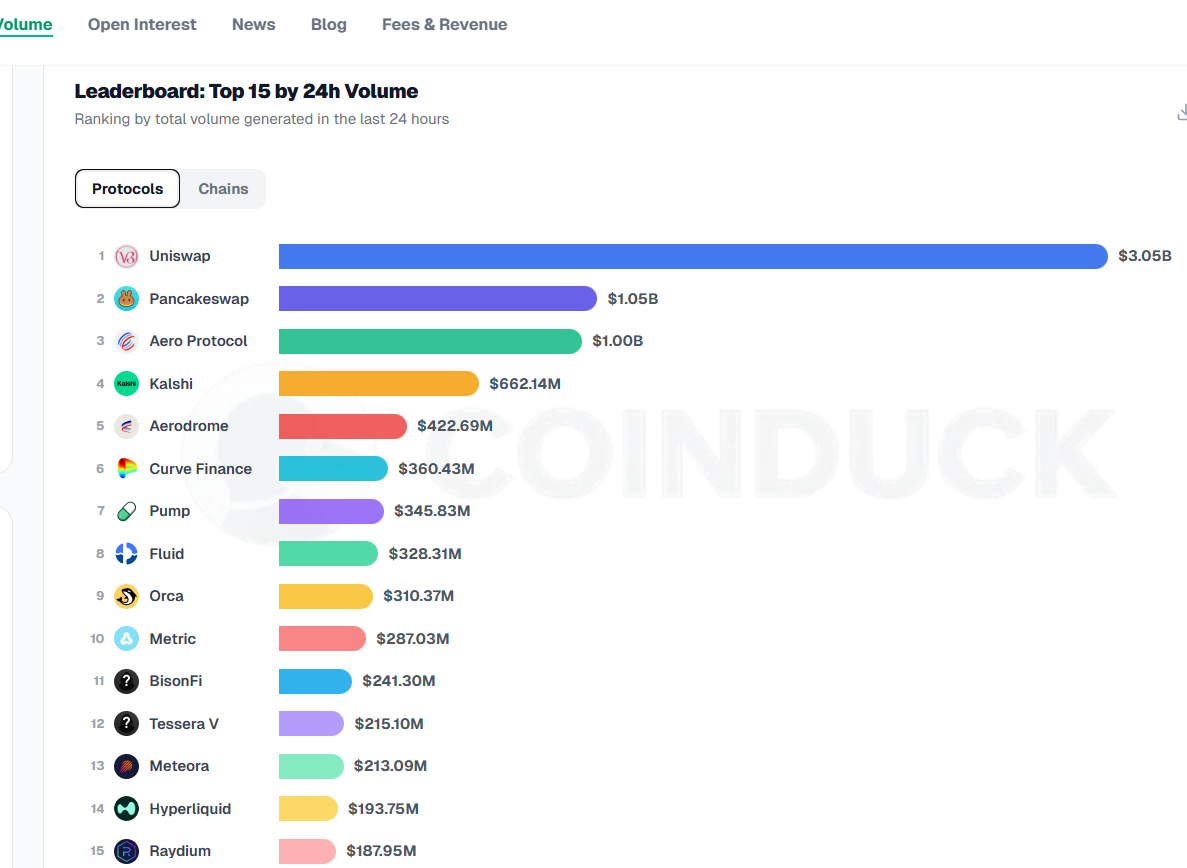
The leaderboard is a ranked list with colored bars. The longer the bar, the higher the 24-hour volume. The dollar amount is shown at the end of each bar.
At the top of the card, you can switch between two tabs:
- Protocols: ranks individual platforms. In the screenshot, Uniswap is first, followed by PancakeSwap (about $1.04B), Aero Protocol (about $983.30M), Kalshi, Aerodrome, Pump, Curve Finance and others. Hyperliquid appears at number 15.
- Chains: ranks blockchains by the trading volume that happens on them.
Each protocol name is clickable and opens that protocol's own page. As the category chart showed, the list can include platforms that are not classic token-swap DEXs, such as prediction markets, so check what each platform does before comparing them.
Volume by Chain
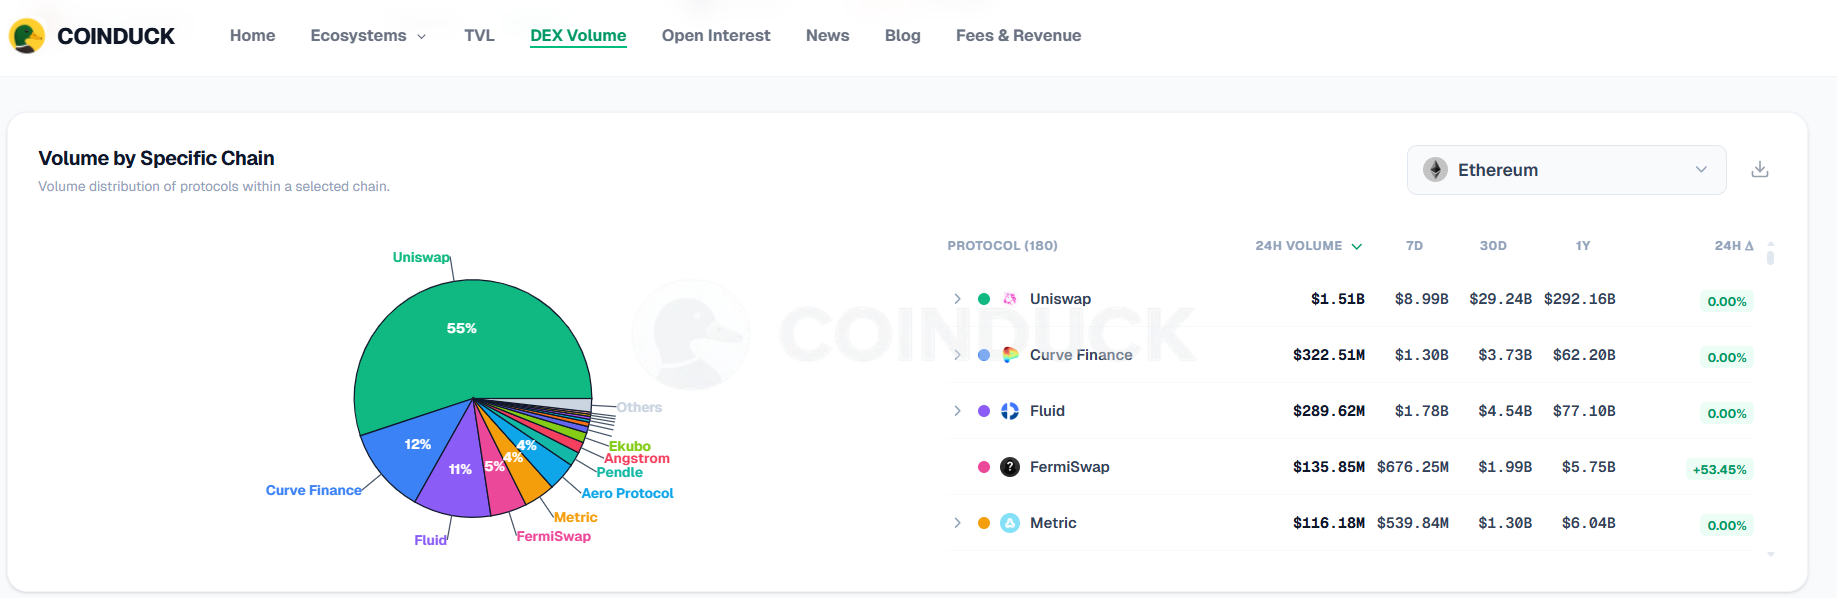
This section shows how total volume is divided between blockchains. It answers a simple question: which networks are busiest?
If one chain has a big share, users and liquidity are concentrated there. If the shares are more even, trading is spread across many networks.
How to Use the DEX Volume Page: A Simple Routine
- Check the summary cards to see if 24-hour volume is up or down compared with yesterday.
- Open the Global Volume Trend chart and pick 30D or 90D to see the bigger picture.
- Look at Volume by Category to see which type of platform is leading.
- Check Top Volume Movers to find protocols that are rising or falling fast.
- Read the leaderboard, then switch to Chains to see the busiest networks.
- Click a protocol name to open its detail page.
Volume only tells you how much trading happened. For a full picture, read it together with Open Interest, TVL and Fees & Revenue.
Open Interest Page: Understand Derivatives Positions
Open interest is the total value of derivative contracts, such as perpetual futures, that are still open and have not been closed or settled. In simple words, trading volume tells you how many trades happened, and open interest tells you how many positions are still alive.
The CoinDuck Open Interest page shows this number across perpetual protocols, blockchains and categories. It helps you see how much money traders are betting with, and where. Let us go through the page section by section.
Open Interest Summary Cards
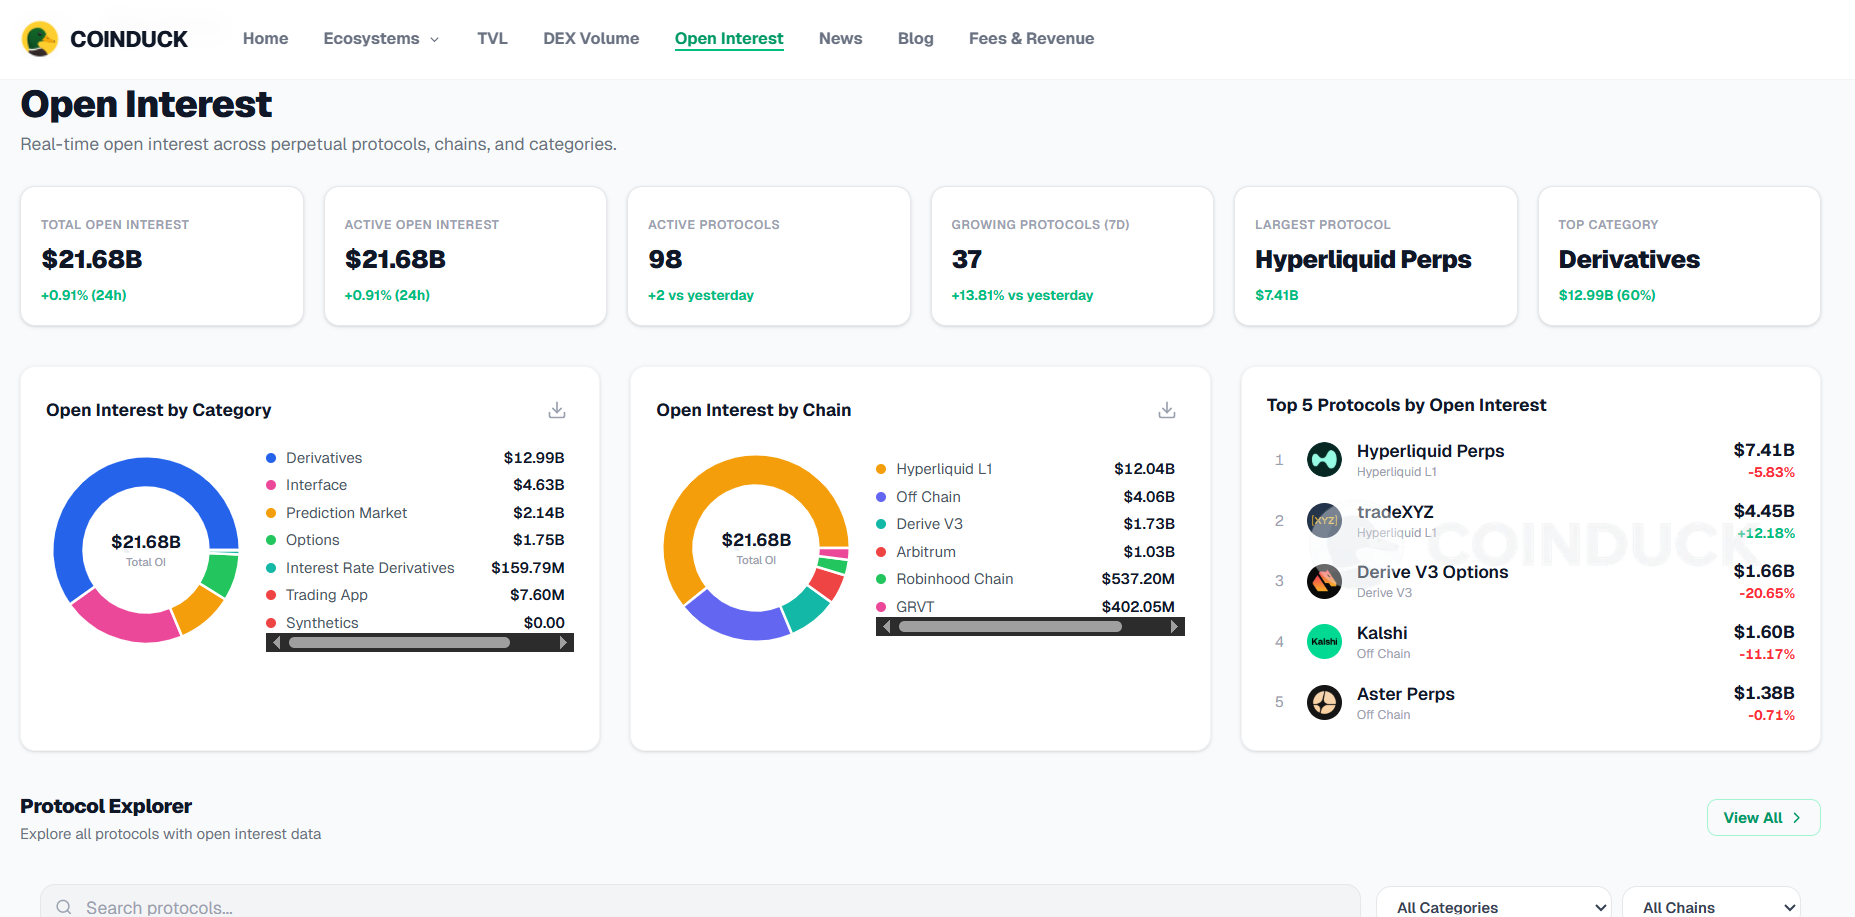
At the top of the page, a row of cards gives you the big picture of the derivatives market:
- Total Open Interest: the combined value of all open positions across the protocols CoinDuck tracks, shown in US dollars.
- Active Open Interest: open interest from protocols that are currently active.
- Active Protocols: how many protocols have open interest data.
- Growing Protocols (7D): how many protocols saw their open interest rise over the last 7 days.
- Largest Protocol: the protocol with the highest open interest right now.
- Top Category: the type of platform that holds the most open interest.
How to read them: a high number of growing protocols means leveraged trading is expanding across the market. A low number means traders are closing positions or staying away.
Open Interest by Category
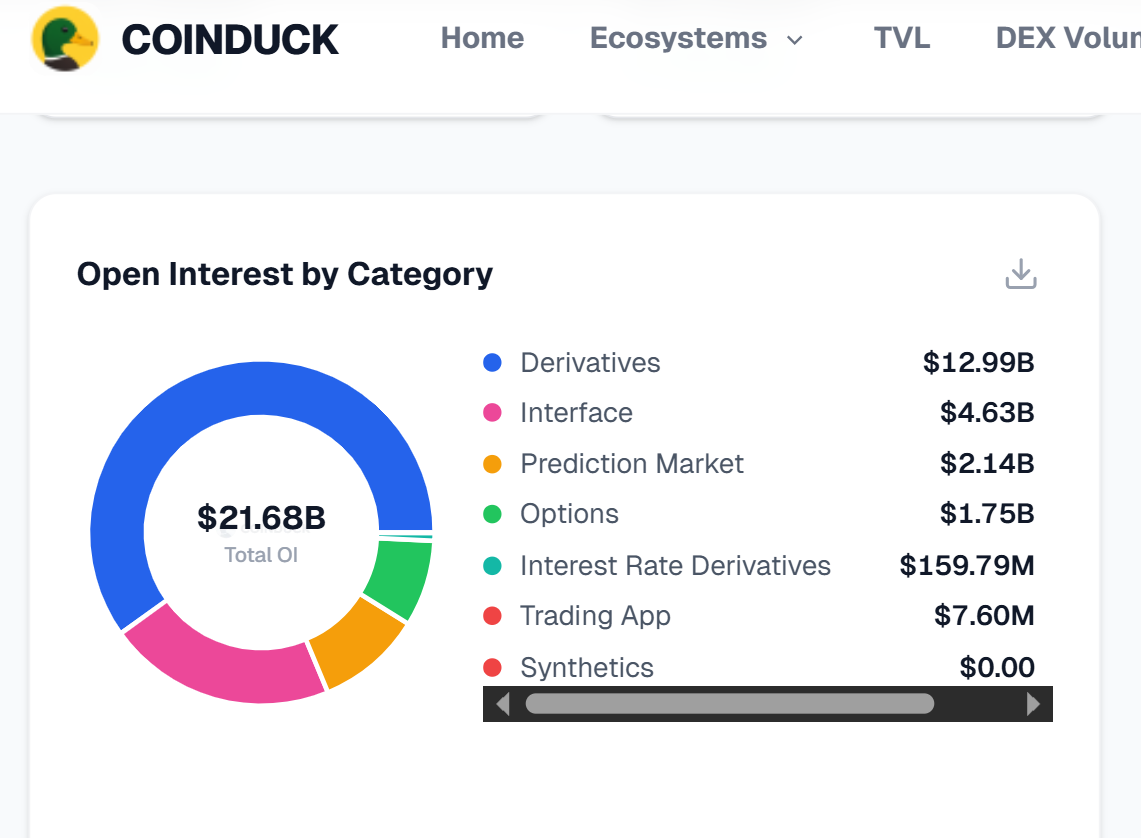
This chart splits total open interest by type of platform, for example perpetual exchanges and other derivatives or prediction-market platforms. Each part of the chart shows a category's share of the total.
Why it matters: it shows which kind of trading holds the most money right now. If one category is much bigger than the others, the market is concentrated in that type of platform.
Open Interest by Chain
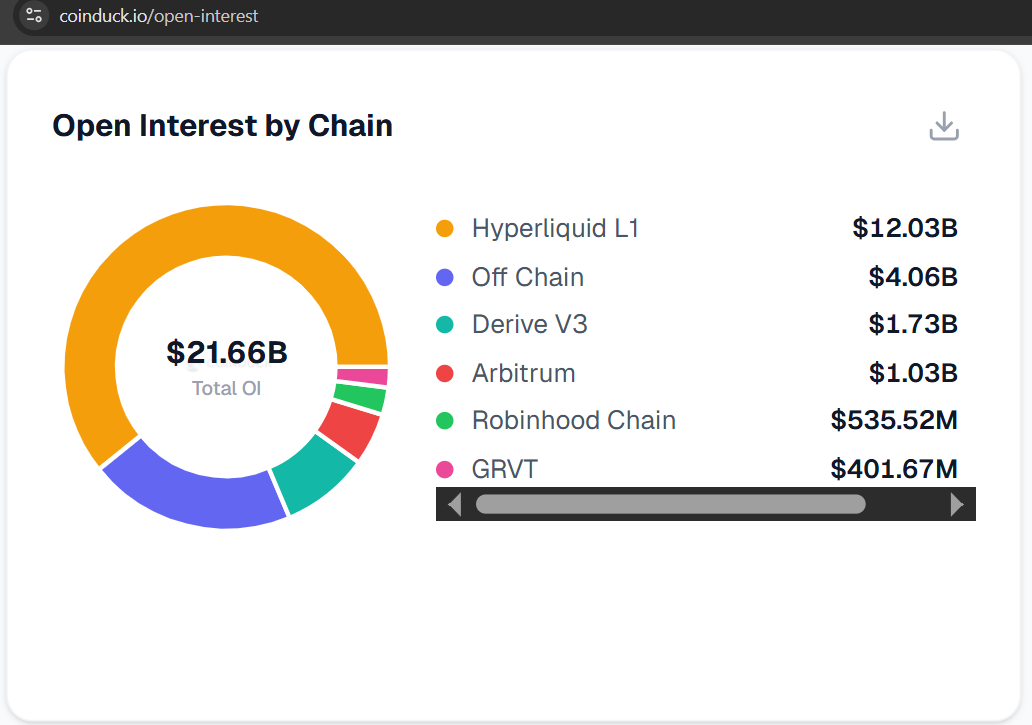
This chart shows how open interest is divided between blockchains. It tells you which networks are home to the most derivatives trading.
A big share for one chain means a lot of traders and money are active there. This is useful if you want to know where the market is most active before you look at a single exchange.
Top 5 Protocols by Open Interest
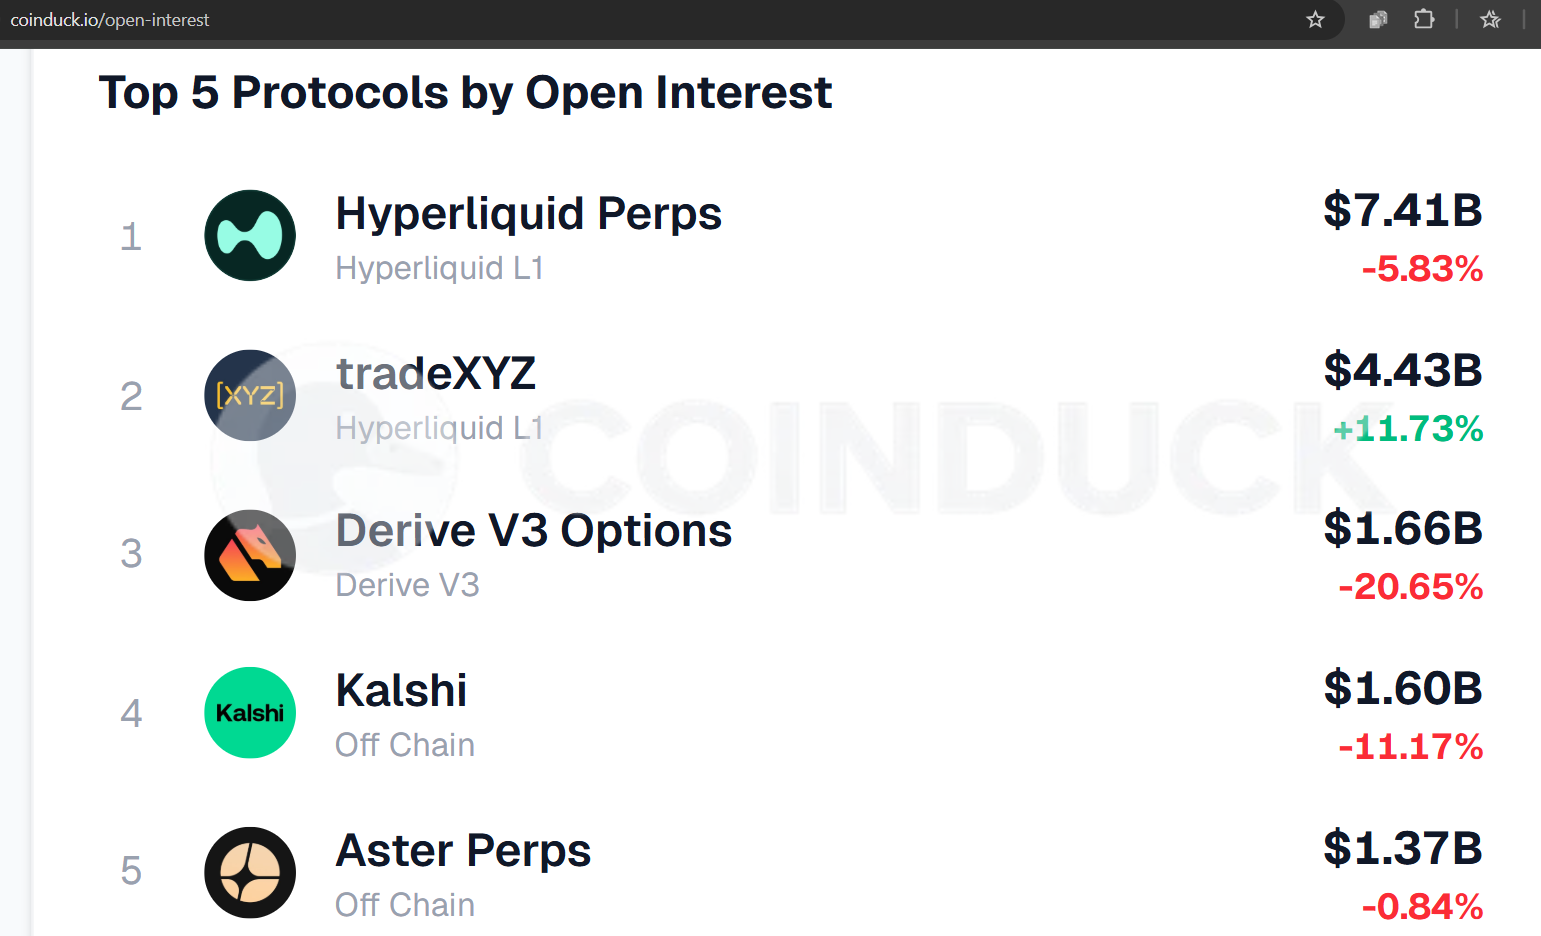
This section ranks the five biggest protocols by open interest. It is a quick way to see who leads the market without scrolling through a long table.
If you want to see more than five, use the Protocol Explorer below it.